
Table of contents
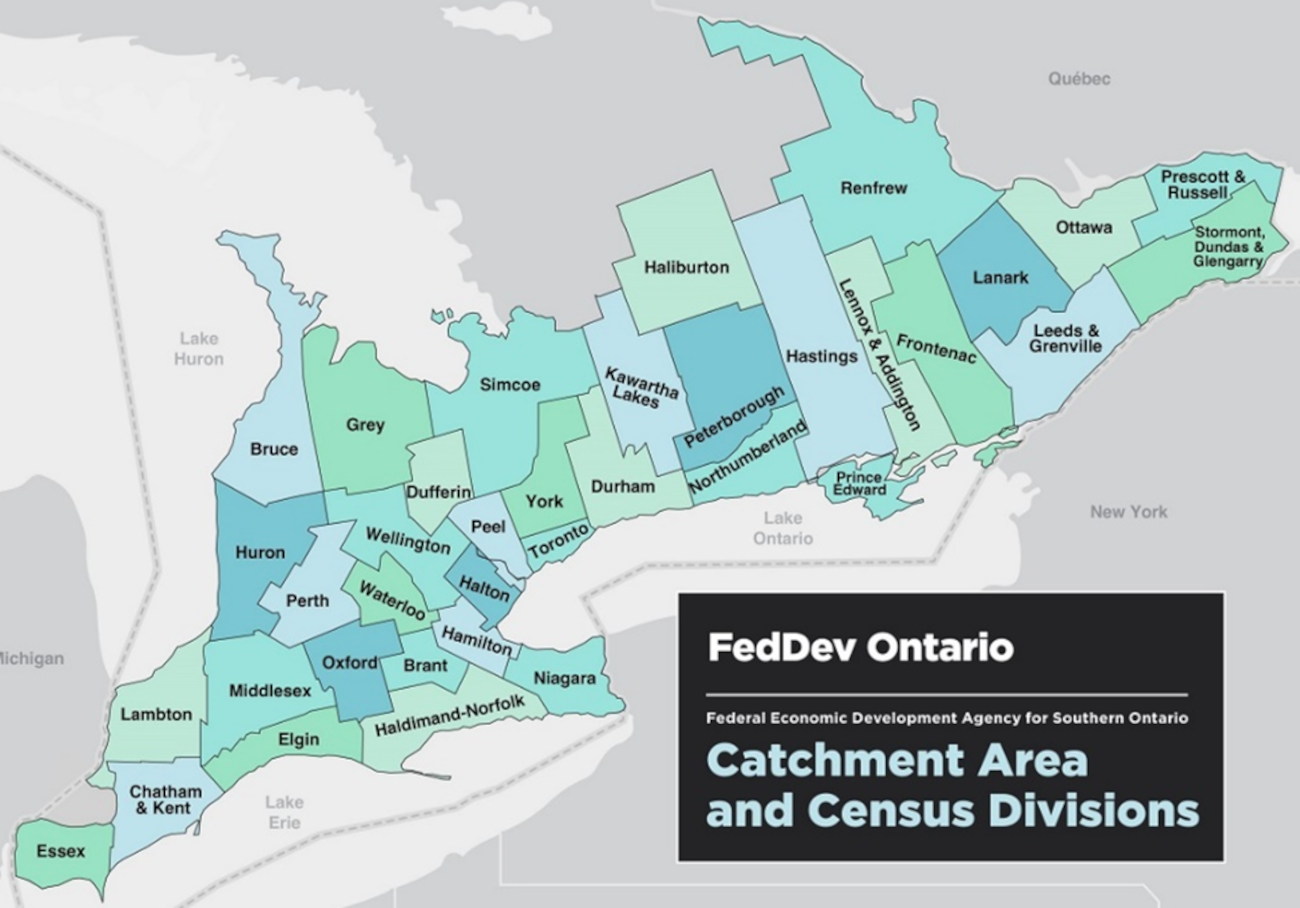
FedDev Ontario - catchment area and census divisions
Key contacts
President
Nancy Gardiner
Tel.: 613-552-0850
Email: nancy.gardiner@feddevontario.gc.ca
A/Chief of Staff
Irwin Cortez
Tel: 343-550-4995
Email: irwin.cortez@feddevontario.gc.ca
Economic overview
Overview
| Ontario GDP (2023) | $1,094B |
|---|---|
| % Canada’s GDP | 37.8% |
| Southern Ontario employment (Nov. 2024) | 7.7M |
| % Canada | 37.5% |
| Southern Ontario unempl. rate (Nov. 2024) | 7.4% |
| Canada unemployment rate | 6.8% |
| Southern Ontario population (2023) | 14.7M |
| % Canada | 36.6% |
| Sources: Ontario Ministry of Finance; Statistics Canada. Southern Ontario typically accounts for ~94% of Ontario’s GDP, population etc | |
Provincial outlook
| 2023 | 2024 | 2025 | 2026 | |
|---|---|---|---|---|
| Real GDP growth (y/y % change) | 1.7 | 1.3 | 2.3 | 2.0 |
| Employment growth (y/y % change) | 2.4 | 1.6 | 1.7 | 1.8 |
| Unemployment rate (%) | 5.7 | 6.9 | 7.4 | 7.1 |
| Source: BMO. December 6, 2024. Bolded values represent forecasts. | ||||
| Top 5 sectors by GDP (2023) | % GDP |
|---|---|
| Real estate | 13% |
| Manufacturing | 11% |
| Finance and insurance | 10% |
| Professional, scientific and technical services | 9% |
| Public administration | 8% |
| Source: Statistics Canada. | |
Economic overview - cont’d
Diversity (Southern Ontario)
| Black population (2021 Census) | 760,335 |
|---|---|
| % of south. Ontario total population | 5.8% |
| Indigenous population (2021 Census) | 252,995 |
| % of south. Ontario total population | 1.9% |
| Visible minorities (2021 Census) | 4.8M |
| % of south. Ontario total population | 36.3% |
| Source: Census 2021. Visible minorities does not include Indigenous people. | |
- Southern Ontario welcomed 43% of all newcomers to Canada between 2016 and 2021 (30% to GTA alone)
(Census 2021) - Toronto is one of the most diverse cities in the world (over 56% of the population identify as a visible minority)
(Census 2021) - Ontario has the largest Indigenous population in Canada, accounting for 22.4% of all Indigenous people in the country
(Census 2021)
Communities
| Electoral districts | 112 out of 338 in Canada |
|---|---|
| Census metropolitan areas (cities) | 14 |
| Census divisions (intermediate geography between province level and municipality) | 37 |
| Census subdivisions (distinct municipalities) | 289 |
|
Rural and small cities population (share of the provincial pop.) |
25% |
| Source: Statistics Canada | |
- Around 3.6M people live in rural and small cities
(Census 2021) - The 5 Largest CMAs: Toronto, Ottawa, Hamilton, Kitchener, London are home to 9.2M Ontarians (64.9%)
(Census 2021)
Tourism
| Employment in tourism-related industries (Jan. - Sep. 2024, avg.) |
773,600 (+0.4% from Jan. - Sep. 2023, avg.) |
|---|---|
| Non-Resident Visitors (2023) (% of all visitors to Canada) | 12.7M (46%) |
| Source: Government of Ontario, Statistics Canada. | |
- Ontario is home to some 28,000 tourism businesses (5.5% of all businesses). Visitor spending added some $28.6B to GDP in 2022
(Invest Ontario and Government of Ontario)
Tech & life science
| Venture capital investment in Ontario (2023) | $3.3B (275 deals) |
|---|---|
| % Canada | 48% |
| Venture capital investment in Ontario 2024 (Jan.- Sept.) | $2.3B (172 deals) |
|
2023 Year-end and H1-2024 CVCA Market Overview. |
|
- Sectors such as ICT and life sciences collectively employed nearly 400K people in Ontario
(Statistics Canada, 2023) - Toronto added 94,900 tech jobs from 2019 to 2023, the largest increase among North American peer jurisdictions. (CBRE, September 2024)
Regional programming and advocacy
The Agency targets the following three outcomes:
- Communities in southern Ontario are economically diversified;
- Businesses in southern Ontario invest in the development and commercialization of innovative technologies; and
- Businesses in southern Ontario are innovative and growing.
FedDev Ontario’s primary activity is the delivery of its regional programming to support economic development, business growth and innovation in southern Ontario. The Agency also serves as a federal presence and advocates for the region within the federal family, working across departments to support regional opportunities.
The Agency delivers the following three streams of ongoing regional programming:
Business Scale-up and Productivity
Helps firms invest in innovative technologies and equipment to support their growth, improve productivity and expand into new markets.
Regional Innovation Ecosystem
Invests in the entrepreneurial environment (e.g., business accelerators and incubators) and supports commercialization and new product and technology development through industry-led consortia.
Community Economic Development and Diversification
Supports collaborative efforts to grow small businesses and create jobs in smaller markets, including rural communities and communities experiencing industrial transition.
Recipient firms tend to outperform comparable businesses on:
- + 12% revenue
- + 24% employment growth
- + 18% R&D spending
- + 40% export growth
Other programming
In addition to its regional programs, FedDev Ontario delivers ongoing national programs to support government priorities. These include the:
- Community Futures Program that provides targeted economic development support to rural communities; and
- Economic Development Initiative that supports economic development in Official Language Minority Communities.
The Agency also delivers temporary national programs, including the:
- Black Entrepreneurship Program Ecosystem Fund that provides support to strengthen the entrepreneurship ecosystem for Black entrepreneurs and business owners across the country;
- Regional Quantum Initiative in southern Ontario that helps companies advance and commercialize their quantum products and solutions;
- Tourism Growth Program that supports communities, small businesses, and non-profit organizations in developing local projects and events;
- Regional Artificial Intelligence Initiative that provides support for commercialization and productization for AI businesses, and adoption of AI in critical sectors; and
- Regional Homebuilding Innovation Initiative that supports innovative manufacturing and homebuilding solutions that will help build more homes faster.