
Statement outlining results, risks and significant changes in operations, personnel, and programs
1. Introduction
This quarterly report has been prepared by management as required by section 65.1 of the Financial Administration Act and in the form and manner prescribed by the Treasury Board Accounting Standard 1.3. This report should be read in conjunction with the 2018–19 Main Estimates. This quarterly report has not been subject to an external audit or review.
1.1 Authority, Mandate and Program Activities
The Federal Economic Development Agency for Southern Ontario (FedDev Ontario) is mandated to "strengthen southern Ontario's economic capacity for innovation, entrepreneurship and collaboration; and promote the development of a strong and diversified southern Ontario economy."
Further details on FedDev Ontario's authorities, mandate and program activities can be found in Part II of the Main Estimates and FedDev Ontario's Departmental Plan for 2018–19.
1.2 Basis of Presentation
This quarterly report has been prepared by management using an expenditure basis of accounting. The accompanying Statement of Authorities includes FedDev Ontario's spending authorities granted by Parliament and those used by FedDev Ontario—consistent with the Main Estimates for the 2018–19 fiscal year. This quarterly report has been prepared using a special-purpose financial reporting framework designed to meet financial information needs with respect to the use of spending authorities.
The authority of Parliament is required before money can be spent by the Government. Approvals are given in the form of annually approved limits through appropriation acts or through legislation in the form of statutory spending authority for specific purposes.
FedDev Ontario uses the full accrual method of accounting to prepare and present its annual financial statements that are part of its performance reporting process. However, the spending authorities voted by Parliament remain on an expenditure basis.
1.3 FedDev Ontario's Financial Structure
FedDev Ontario manages its expenditures under two votes:
- Vote 1 – Net operating expenditures include the Agency's authorities related to personnel costs, operation and maintenance expenditures; and
- Vote 5 – Grants and contributions include all authorities related to transfer payments.
Expenses under budgetary statutory authorities, for which payments are made under a law previously approved by Parliament and which are not part of the annual appropriations bills, include items such as employer's portion of the employee benefit plan.
2. Highlights of Fiscal Quarter and Fiscal Year-to-Date (YTD) Results
This section highlights the significant items that contributed to the net increase or decrease in authorities available for the year and actual expenditures for the quarter ended September 30, 2018.
2.1 Authorities Analysis
As of this quarter, the total authorities available for use and planned expenditures decreased to $213 million for fiscal year 2018–19, compared to $270.7 million for fiscal year 2017–18, as illustrated in the "Statement of Authorities" table. The net decrease of $57.7 million (or 21 percent) relates to:
- $0.3 million increase in Vote 1 (Operating Authorities);
- $58 million decrease in Vote 5 (Grants and Contributions Authorities); and
- $0.03 million increase in Statutory Authorities.
Vote 1 — Operating Authorities
Total Vote 1 Operating Authorities available for use for the year ending March 31, 2019, amount to $26 million, compared to $25.7 million for fiscal year 2017–18, representing a net increase of $0.3 million (or 1 percent) as a result of an increased Operating Budget Carry-Forward in 2018–19.
Vote 5 — Grants and Contributions
Total Vote 5 Grants and Contributions Authorities available for use for the year ending March 31, 2019, amount to $184.2 million, compared to $242.2 million for fiscal year 2017–18. The net decrease of $58 million (or 24 percent) in funding is primarily the result of:
- A decrease of $68.8 million with the sunset of the Canada 150 Community Infrastructure Program;
- A decrease of $11.9 million in funding for Advanced Manufacturing Fund due to a previous year reallocation; and
- An increase of $25 million renewal of base funding as announced in Budget 2018.
Budgetary Authorities Available
(in millions of dollars)

| Fiscal Year (in millions of dollars) |
||
|---|---|---|
| 2017–18 | 2018–19 | |
| Operating Spending Authorities | 25.7 | 26.0 |
| Program Spending Authorities | 242.2 | 184.2 |
| Statutory Authorities | 2.8 | 2.8 |
| Total | 270.7 | 213 |
2.2 Expenditure Analysis
Year-to-date expenditures as of September 30, 2018, totaled $69.8 million, a decrease of $15.2 million (18 percent) compared to $85 million at the same point in 2017. The variance is primarily related to a decrease in transfer payment expenditures and a decrease in net operating expenditures.
Year To Date Expenditures as at September 30, 2018
(in millions of dollars)

| Fiscal Year (in millions of dollars) |
||
|---|---|---|
| 2017–18 | 2018–19 | |
| Operating Spending Authorities | 12.6 | 11.6 |
| Program Spending Authorities | 71.0 | 56.8 |
| Statutory Authorities | 1.4 | 1.4 |
| Total | 85 | 69.8 |
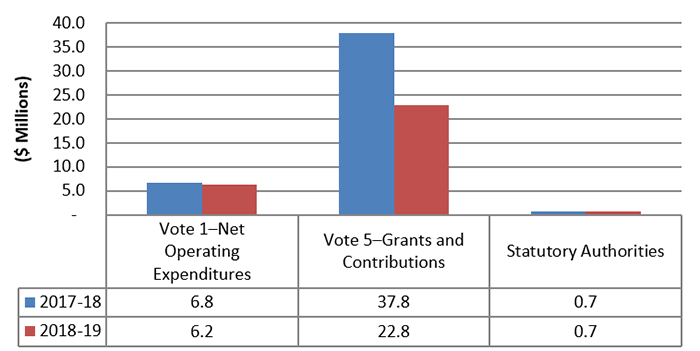
Budgetary expenditures in the second quarter of 2018–19 totaled $29.7 million, compared to $45.3 million for the same period in 2017–18, as illustrated in the "Departmental Budgetary Expenditures by Standard Object" tables. The net decrease of $15.6 million (34 percent) primarily relates to:
- $1.0 million decrease in Vote 1 (Operating) expenditures; and
- $14.2 million decrease in Vote 5 (Grants and Contributions) expenditures.
Vote 1 (Operating Expenditures)
Second quarter expenditures for operating decreased by $0.6 million (or 7 percent) compared to the same period in the previous fiscal year, primarily a result of retroactive salary payments made in 2017–18 related to the settlement of public service collective agreements.
Expenditures in other standard objects did not see significant fluctuations.
Vote 5 (Grants and Contributions)
Spending on transfer payments in the second quarter decreased $15 million (or 40 percent) over the previous year, primarily due to the sunsetting of the Canada 150 Community Infrastructure Program.
(For additional information on expenditures, see the Departmental Budgetary Expenditures by Standard Object table in the Appendix.)
Second Quarter Budgetary Expenditures
(in millions of dollars)
| Fiscal Year (in millions of dollars) |
||
|---|---|---|
| 2017–18 | 2018–19 | |
| Operating Spending Authorities | 6.8 | 6.2 |
| Program Spending Authorities | 37.8 | 22.8 |
| Statutory Authorities | 0.7 | 0.7 |
| Total | 45.3 | 29.7 |
3. Risks and Uncertainties
FedDev Ontario maintains a governance structure for oversight of financial management and a strong system of internal controls and well-defined framework of accountabilities, policies and procedures, including its Framework on Internal Control over Financial Reporting. The Agency mitigates financial risk through monitoring the impact of fluctuations in cash flows for multi-year projects and reallocation of funding to priority initiatives as needed.
FedDev Ontario also completes an annual risk assessment exercise and maintains a service level agreement with the Office of the Comptroller General for the delivery of internal audit services to provide independent advice on risk management, control and governance processes.
4. Significant Changes in Relation to Operations, Personnel and Programs
On September 4, 2018, Lisa St-Amour was appointed as acting Chief Financial Officer.
Approval by Senior Officials
![]()
James Meddings
President
Ottawa, Canada
![]()
Lisa St-Amour
A/Chief Financial Officer
| (in thousands of dollars) | Fiscal Year 2018–19 | Fiscal Year 2017–18 | |||||
|---|---|---|---|---|---|---|---|
| Total available for use for the year ending March 31, 2019Footnote 1 | Used during the quarter ended September 30, 2018 | Year to date used at quarter-end | Total available for use for the year ending March 31, 2018Footnote 1 | Used during the quarter ended September 30, 2017 | Year to date used at quarter-end | ||
| Vote 1–Net Operating Expenditures | 25,980 | 6,239 | 11,588 | 25,682 | 6,755 | 12,602 | |
| Vote 5–Grants and Contributions | 184,188 | 22,821 | 56,847 | 242,199 | 37,829 | 70,957 | |
| Budgetary statutory authorities: | 2,789 | 697 | 1,394 | 2,755 | 689 | 1,378 | |
| Total authorities | 212,957 | 29,757 | 69,829 | 270,636 | 45,273 | 84,937 | |
| (in thousands of dollars) | Fiscal Year 2018–19 | Fiscal Year 2017–18 | |||||
|---|---|---|---|---|---|---|---|
| Planned expenditures for the year ending March 31, 2019Footnote 1 | Used during the quarter ended September 30, 2018 | Year to date used at quarter-end | Planned expenditures for the year ending March 31, 2018Footnote 1 | Used during the quarter ended September 30, 2017 | Year to date used at quarter-end | ||
| Expenditures: | |||||||
| PersonnelFootnote 2 | 21,957 | 5,372 | 10,870 | 21,593 | 6,562 | 12,509 | |
| Transportation and communications | 813 | 153 | 286 | 766 | 242 | 398 | |
| Information | 329 | 72 | 108 | 414 | 4 | 40 | |
| Professional and special services | 5,023 | 1,285 | 1,607 | 5,077 | 599 | 911 | |
| Rentals | 135 | 25 | 52 | 167 | 20 | 34 | |
| Repair and maintenance | 166 | 1 | 8 | 168 | (7) | 22 | |
| Utilities, materials and supplies | 106 | 11 | 21 | 107 | 14 | 26 | |
| Acquisition of land, buildings and works | – | – | – | – | – | – | |
| Acquisition of machinery and equipment | 169 | 6 | 20 | 54 | 7 | 36 | |
| Transfer payments | 184,188 | 22,821 | 56,847 | 242,198 | 37,829 | 70,957 | |
| Other subsidies and payments | 71 | 9 | 10 | 92 | 3 | 4 | |
| Total budgetary expenditures | 212,957 | 29,755 | 69,829 | 270,636 | 45,273 | 84,937 | |