
Statement outlining results, risks and significant changes in operations, personnel and programs
1. Introduction
This quarterly report has been prepared by management as required by section 65.1 of the Financial Administration Act and in the form and manner prescribed by the Treasury Board. This report should be read in conjunction with the 2023–24 Main Estimates and Supplementary Estimates. This quarterly report has not been subject to an external audit or review.
1.1 Authority, mandate and core responsibility
The Federal Economic Development Agency for Southern Ontario's (FedDev Ontario) mandate is to "strengthen southern Ontario's economic capacity for innovation, economic development and growth, and to promote a dynamic, inclusive and globally-competitive southern Ontario."
Details and additional information on FedDev Ontario's authorities, mandate and core responsibility can be found in Part II of the Main Estimates and FedDev Ontario's Departmental Plan for 2023–24.
1.2 Basis of presentation
This quarterly report has been prepared by management using an expenditure basis of accounting. The accompanying Statement of Authorities includes FedDev Ontario's spending authorities granted by Parliament and those used by FedDev Ontario, consistent with the Main and Supplementary Estimates for the 2023–24 fiscal year. This quarterly report has been prepared using a special-purpose financial reporting framework designed to meet financial information needs with respect to the use of spending authorities.
The authority of Parliament is required before money can be spent by the government. Approvals are given in the form of annually approved limits through appropriation acts or through legislation in the form of statutory spending authority for specific purposes.
FedDev Ontario uses the full accrual method of accounting to prepare and present its annual financial statements that are part of its performance reporting process. However, the spending authorities voted by Parliament remain on an expenditure basis.
1.3 FedDev Ontario's financial structure
FedDev Ontario manages its expenditures under two votes:
- Vote 1 – Net operating expenditures include the Agency's authorities related to salary and operating expenditures; and
- Vote 5 – Grants and Contributions include all authorities related to transfer payments.
Expenses under budgetary statutory authorities, for which payments are made under a law previously approved by Parliament and which are not part of the annual appropriations bills, include items such as the Government of Canada's portion of the employee benefit plan and Minister's motor car allowance.
2. Highlights of fiscal quarter and fiscal year-to-date (YTD) results
This section highlights the significant items that contributed to the net increase or decrease in authorities available for the year and actual expenditures for the quarter ended December 31, 2023.
2.1 Authorities analysis (Vote 1 – Operating, Vote 5 – Grants and Contributions and Statutory Authorities)
Total authorities as of December 31, 2023, total $465.0 million which is a decrease compared to $703.9 million for the same period last fiscal year, as illustrated in the "Statement of Authorities" table.
The net decrease of $238.9 million relates to:
- $2.6 million decrease in Vote 1 (Operating Authorities);
- $236.0 million decrease in Vote 5 (Grants and Contributions Authorities); and
- $0.3 million decrease in statutory authorities.
Vote 1 – Operating Authorities
Total Vote 1 Operating Authorities available for use for the year ending March 31, 2024, amount to $41.4 million, compared to $44.0 million for fiscal year 2022–23, which is a net decrease of $2.6 million. The net decrease is attributed to the reduction of operating funds as the temporary, multi-year initiatives announced in Budget 2021 come to a close.
Vote 5 – Grants and Contributions
Total Vote 5 Grants and Contributions Authorities in 2023–24 is $419.2 million, compared to $655.2 million for fiscal year 2022–23, which is a net decrease of $236.0 million. This decrease relates to the sunsetting of Budget 2021 initiatives to support economic recovery in southern Ontario.
Statutory Authorities
Total statutory authorities granted for use for the year ending March 31, 2024, amount to $4.4 million, compared to $4.7 million in 2022–23, which represents a net decrease of $0.3 million. This decrease in the authorities relates to annual adjustments made to authorities provided for employee benefits plan.
Budgetary Authorities Available
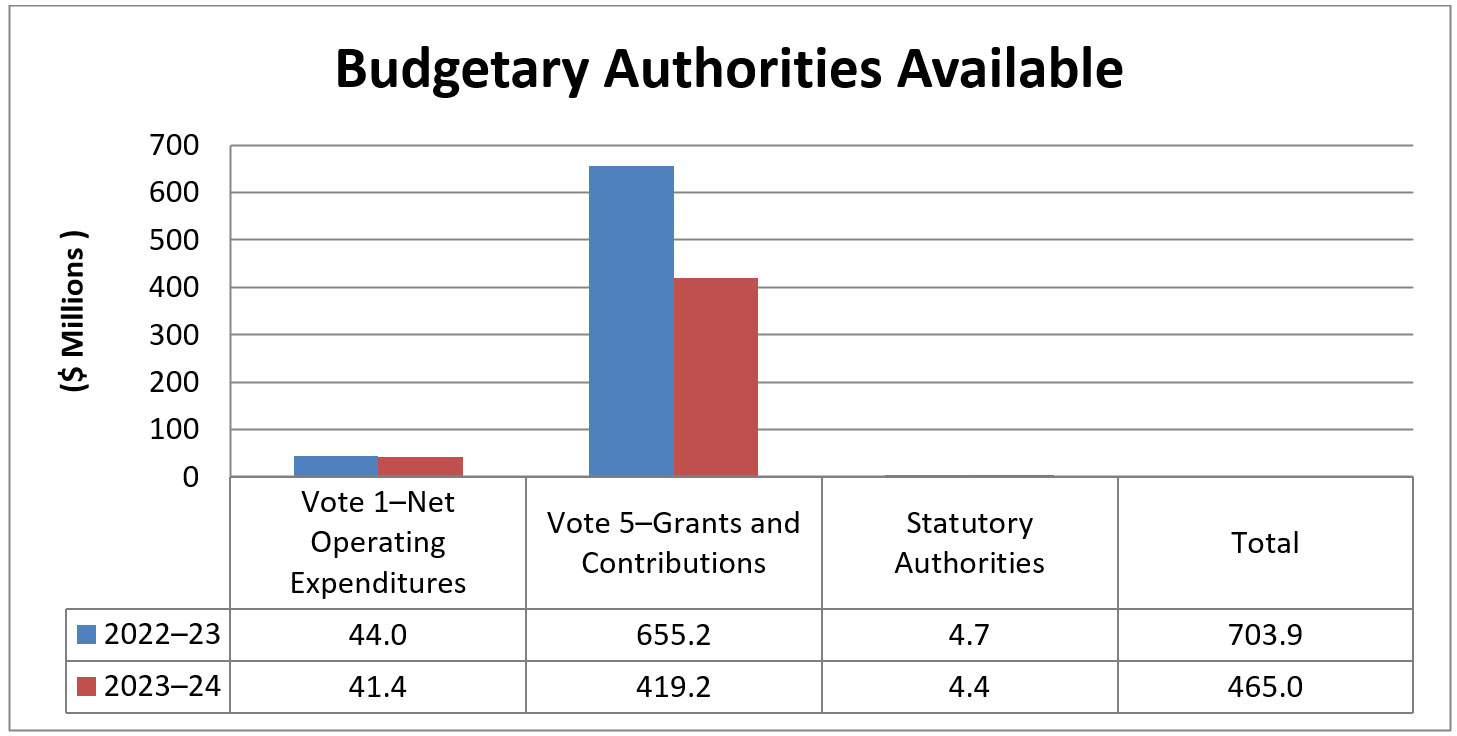
Note: Totals presented may not add up due to rounding
2.2 Expenditure analysis
Year-to-date expenditures as at December 31, 2023, totaled $234.5 million, a decrease of $83.5 million, compared to $318.0 million at December 31, 2022. The decrease in spending is primarily attributed to the reduction of grants and contributions made through the Budget 2021 temporary programming, as those initiatives come to a close.
Year-to-date Expenditures as at December 31, 2023
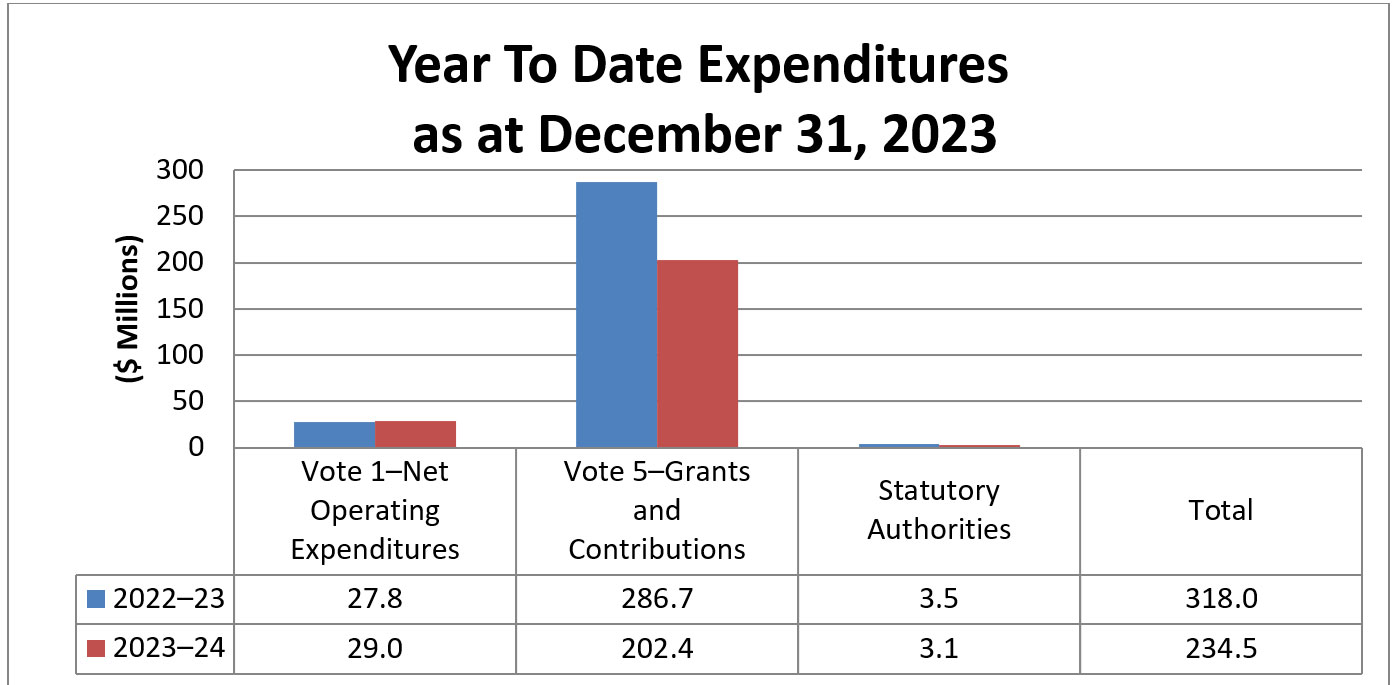
Note: Totals presented may not add up due to rounding.
Budgetary expenditures in the third quarter of 2023–24 totaled $87.9 million, compared to $127.4 million in the same period of 2022–23, as illustrated in the "Third Quarter Budgetary Expenditures" chart. The net decrease of $39.6 million is attributed primarily to decreased spending in grants and contributions for the sunsetting of Budget 2021 initiatives.
Vote 1 (Operating Expenditures)
Operating expenditures in the third quarter of 2023–24 were $11.0 million compared to $9.7 million in the same period of 2022–23. The change in operating expenditures is driven primarily by increased expenditures under the Personnel standard object. Year-to-date personnel expenses increased by $1.3 million over fiscal 2023–24, which aligns with spending plans to wind down the Budget 2021 multi-year recovery programming.
Total expenditures across other operating standard objects remained consistent with prior year activity.
Vote 5 (Grants and Contributions)
Spending on transfer payments was $75.8 million in the third quarter of 2023–24, compared to $116.6 million in the same quarter of 2022–23. The decrease in quarterly spending is attributed primarily to the sunsetting of Budget 2021 initiatives. Year-to-date grants and contributions expenditures total $202.4 million, a decrease of $84.3 million from 2022–23. This aligns with decreased spending related to Budget 2021 initiatives.
Statutory Authorities
Spending through statutory authorities was $1.0 million in the third quarter of 2023–24, compared to $1.2 million in the same quarter of 2022–23. This decrease in expenditures is attributed to lower costs for employee benefit plan contributions related to decreased salary authorities.
Third Quarter Budgetary Expenditures (Year-To-date)
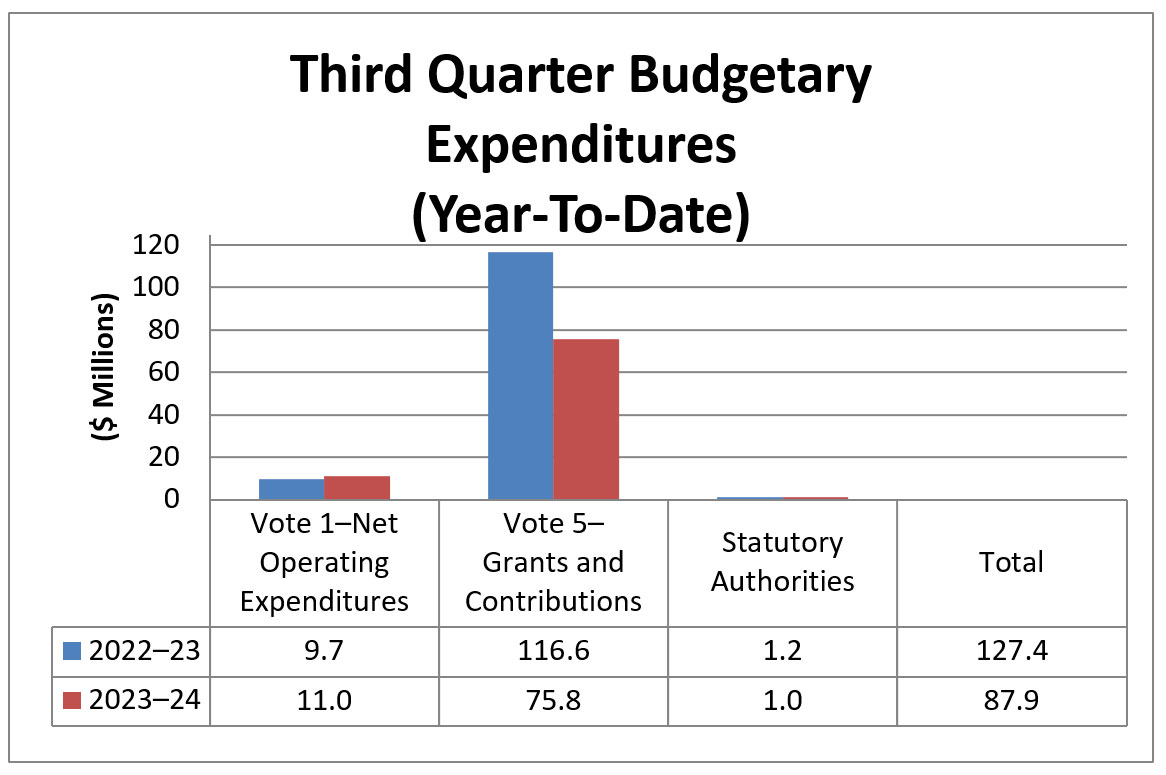
Note: Totals presented may not add up due to rounding.
3. Risks and uncertainties
In 2023–24, FedDev Ontario will be winding down the suite of Budget 2021 initiatives, returning to its core of innovation-based initiatives and smaller national programs. Mounting pressures in the Canadian economy, uncertainty around potential economic slowdowns and impacts of interest rate increases have the potential to impact the capacity of recipients to deliver on funded projects.
4. Significant changes in relation to operations, personnel and programs
After delivering more than $496 million for the Regional Relief and Recovery Fund (RRRF) and over $600 million in Budget 2021 initiatives, FedDev Ontario is returning to pre-pandemic reference levels. Over the course of the 2023–24 fiscal year, the Agency will be transitioning to operational and staffing levels that reflect this lower level of grants and contributions programming.
Subsequent to the quarter end, Carole Bourget was appointed as FedDev Ontario's Chief Financial Officer on January 2, 2024.
Approval by Senior Officials
Nancy Gardiner
President
Ottawa, Canada
Carole Bourget
Chief Financial Officer
| Fiscal Year 2023–24 | Fiscal Year 2022–23 | |||||
|---|---|---|---|---|---|---|
| Total available for use for the year ending March 31, 2024Footnote 2 | Used during the quarter ended December 31, 2023 | Year-to-date used at quarter-end | Total available for use for the year ending March 31, 2023Footnote 2 | Used during the quarter ended December 31, 2022 | Year-to-date used at quarter-end | |
| Vote 1–Net Operating Expenditures | 41,386 | 11,026 | 28,954 | 44,023 | 9,699 | 27,817 |
| Vote 5–Grants and Contributions | 419,225 | 75,793 | 202,405 | 655,183 | 116,557 | 286,658 |
| Budgetary statutory authorities | 4,368 | 1,037 | 3,113 | 4,722 | 1,180 | 3,541 |
| Total authorities | 464,979 | 87,856 | 234,472 | 703,928 | 127,436 | 318,016 |
|
||||||
| Fiscal Year 2023–24 | Fiscal Year 2022–23 | |||||
|---|---|---|---|---|---|---|
| Total available for use for the year ending March 31, 2024 | Used during the quarter ended December 31, 2023 | Year-to-date used at quarter-end | Total available for use for the year ending March 31, 2023 | Used during the quarter ended December 31, 2022 | Year-to-date used at quarter-end | |
| PersonnelFootnote 2 | 35,193 | 10,772 | 29,035 | 37,227 | 9,726 | 28,700 |
| Transportation and communications | 740 | 175 | 416 | 715 | 127 | 210 |
| Information | 900 | 140 | 327 | 866 | 195 | 263 |
| Professional and special services | 7,500 | 808 | 2,052 | 7,405 | 422 | 1,569 |
| Rentals | 375 | 55 | 86 | 346 | 81 | 128 |
| Repair and maintenance | 59 | 1 | 54 | 1 | 7 | |
| Utilities, materials and supplies | 162 | 112 | 126 | 155 | 9 | 32 |
| Acquisition of land, buildings and works | - | - | - | 0 | - | - |
| Acquisition of machinery and equipment | 806 | 3 | 28 | 759 | 318 | 397 |
| Transfer payments | 419,225 | 75,793 | 202,405 | 655,183 | 116,557 | 286,658 |
| Other subsidies and payments | 19 | 2 | 4 | 1,218 | - | 52 |
| Total budgetary expenditures | 464,979 | 87,856 | 234,472 | 703,928 | 127,436 | 318,016 |
|
||||||
ISSN 2368-3481